Data Visualization (UX Design)
Data-Driven Optimization of a Digital Financial Tool
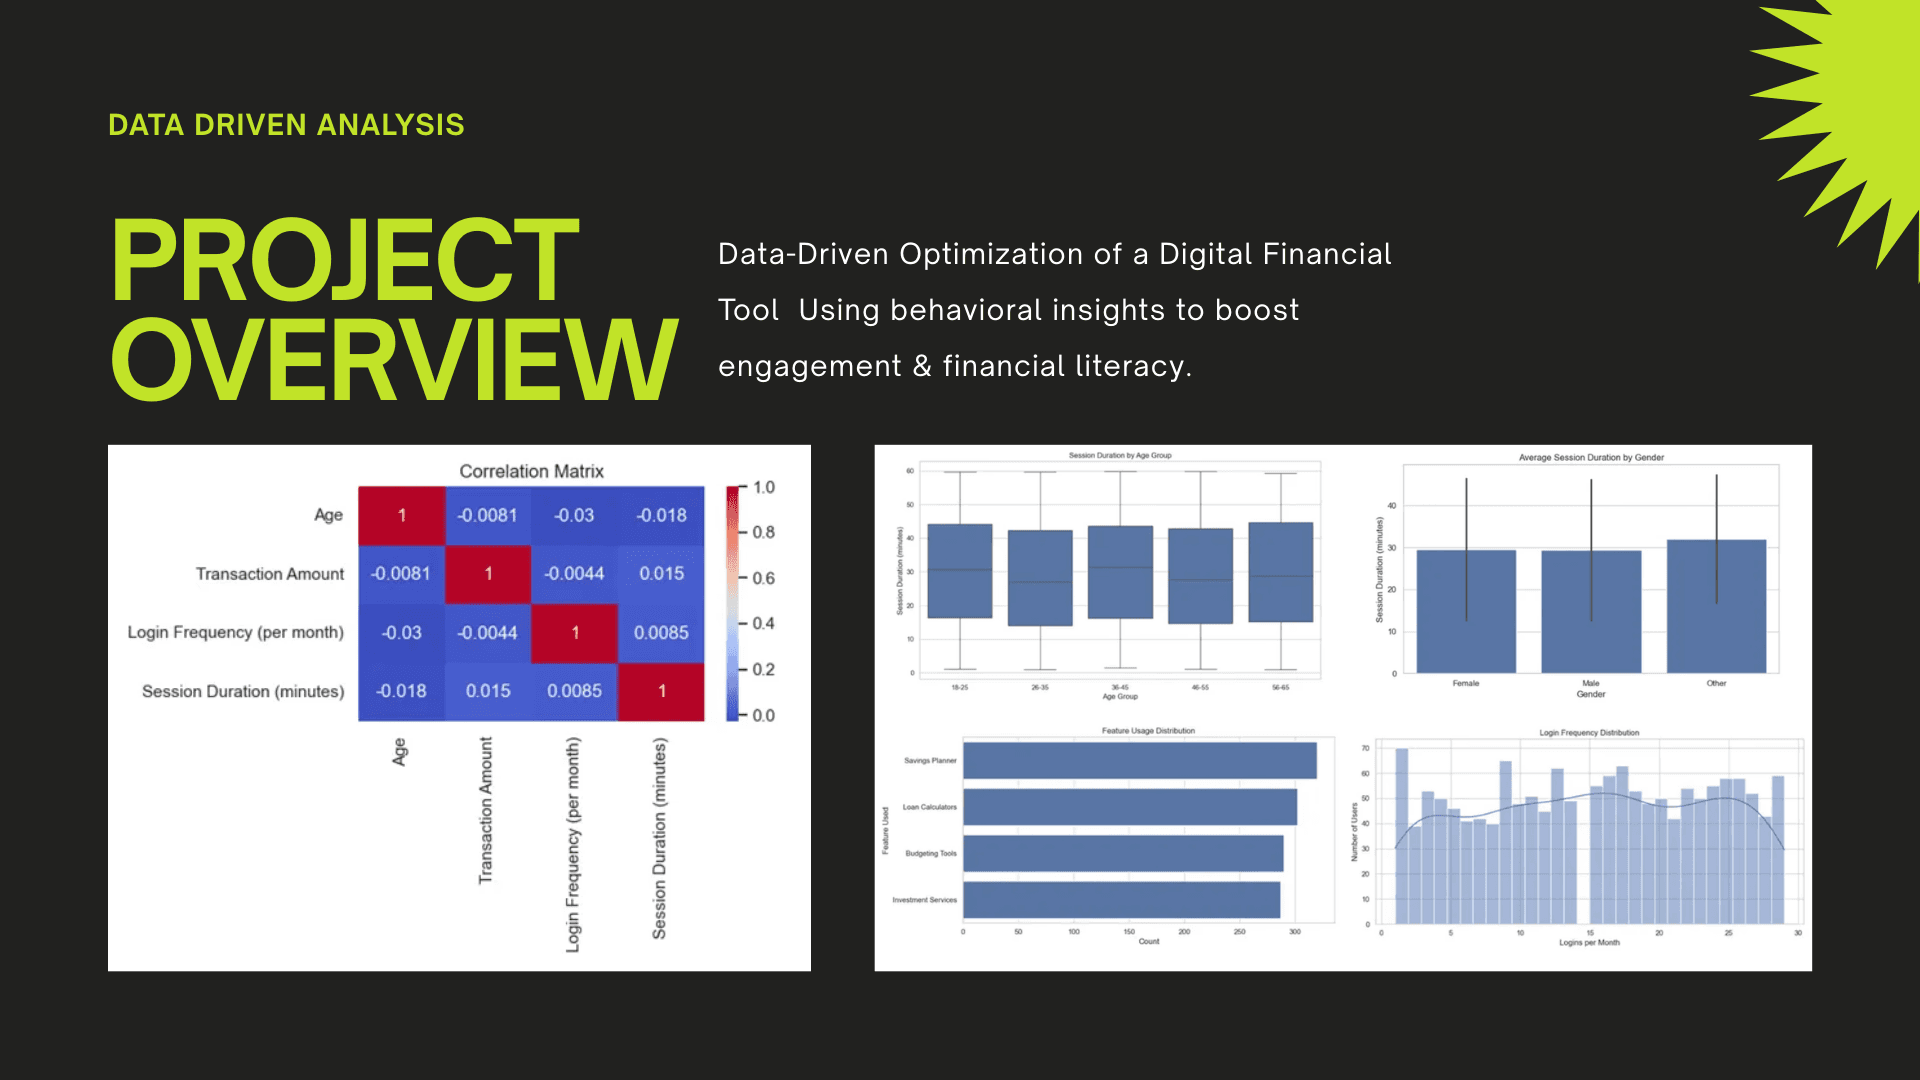
This research project focused on analyzing anonymized customer transaction and behavior data to identify key pain points and propose actionable enhancements for a financial service platform. The dataset included over 1,500 customer records spanning demographics, transaction history, and app interaction metrics.
Year :
2025
Industry :
Banking
Client :
Forage - Lloyd Banking Course
Project Duration :
2 weeks

Problem:
The digital financial tool was struggling to create meaningful engagement. Despite having useful features like a savings planner and loan calculator, adoption remained low. Younger users (18–35) in particular showed:
Short, inconsistent sessions (average 40% shorter than older groups).
Underutilization of planning tools (only ~18% adoption).
Behavioral signals of financial risk (frequent withdrawals and transfers, overdraft exposure).
👉 In short: users had tools available, but they weren’t discovering or connecting with them.
Solution:
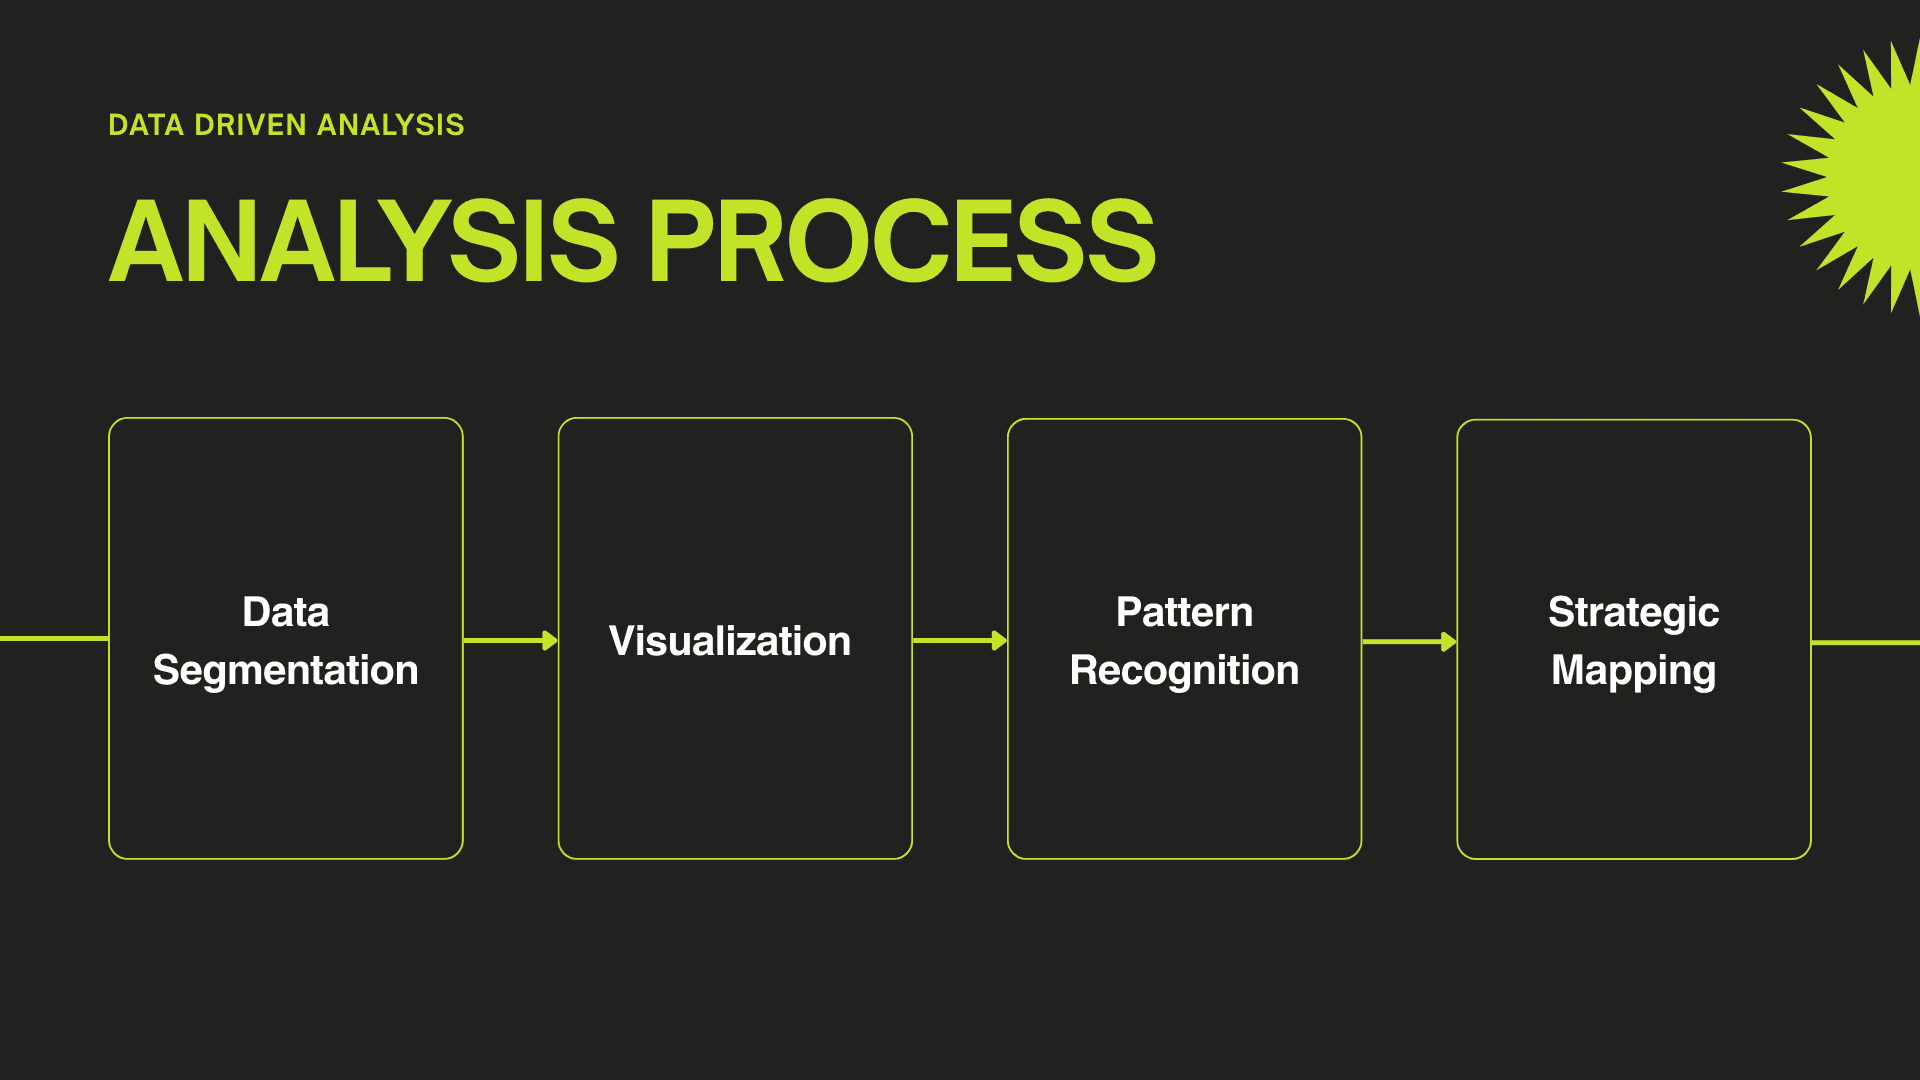
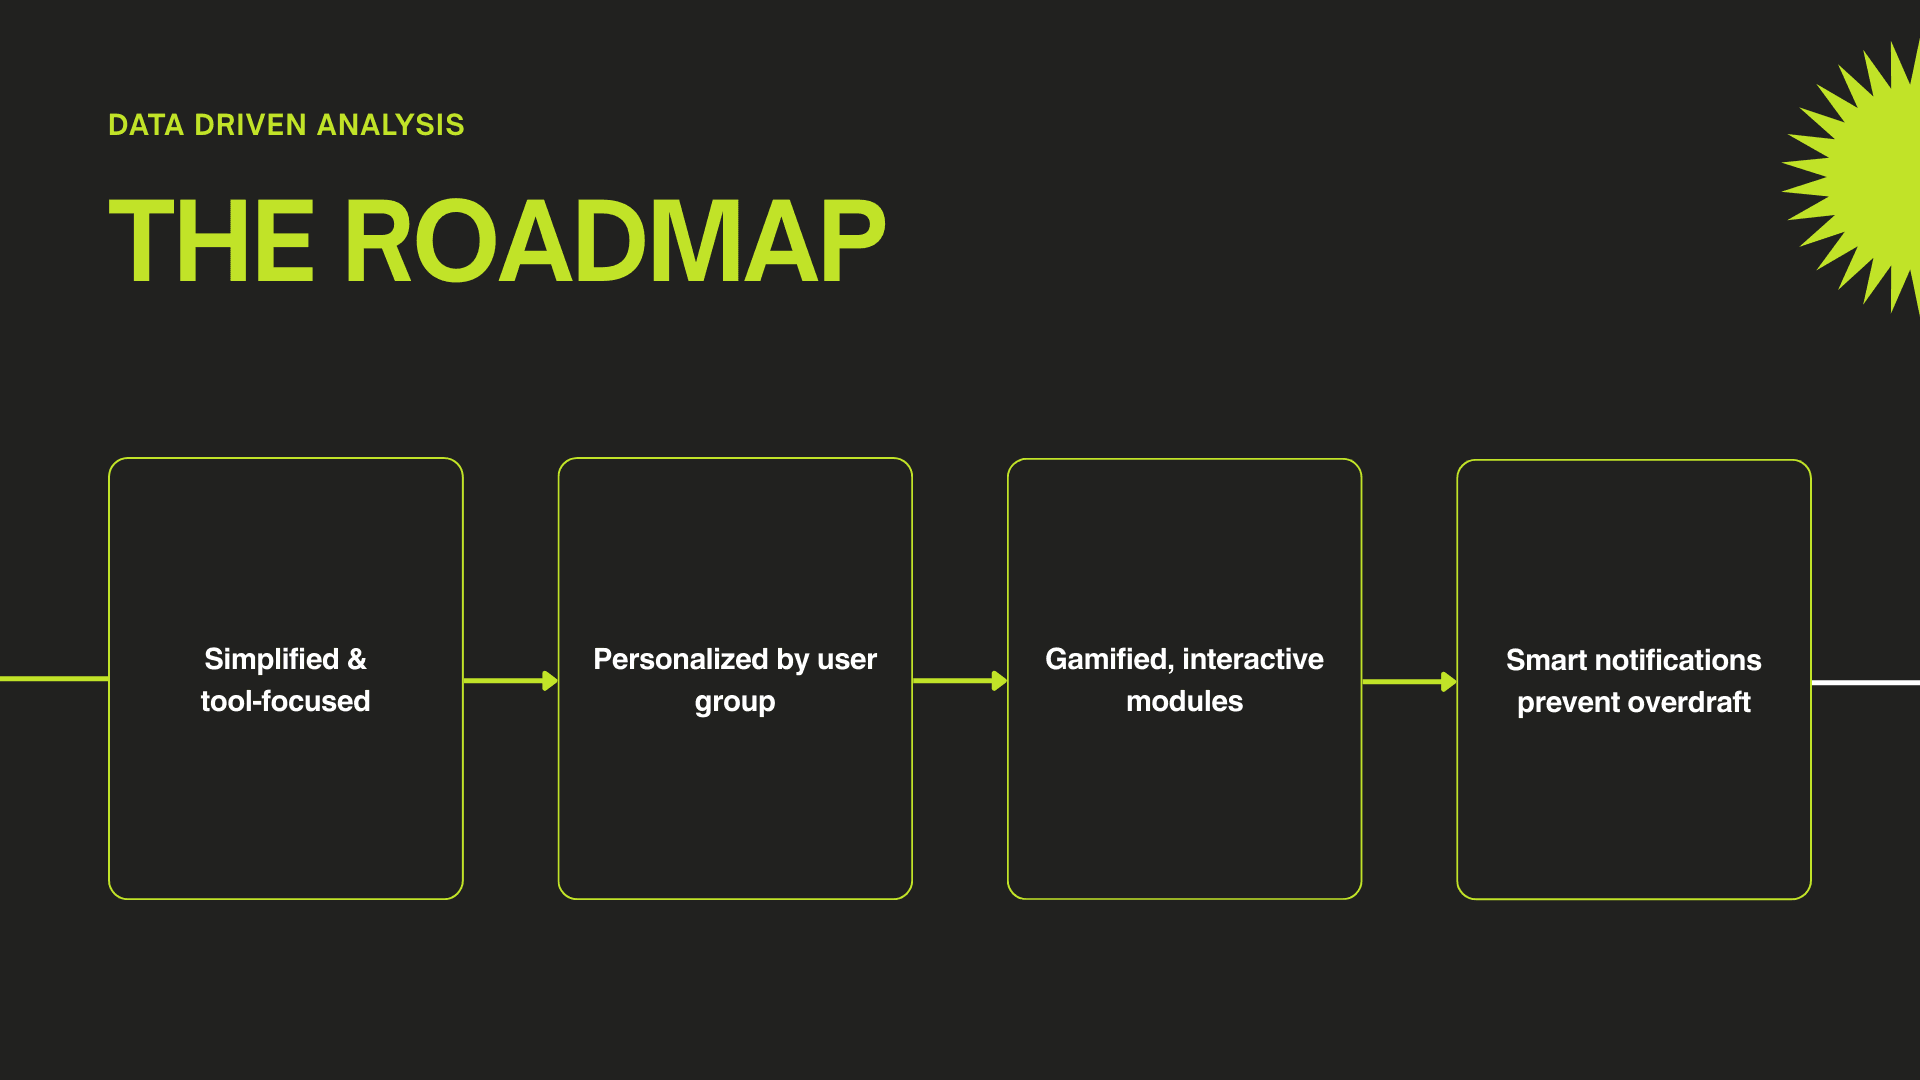
A data-driven product optimization strategy was developed to align platform features with user needs:
UI/UX Redesign → Simplified navigation, made financial tools more discoverable.
Gamification → Rewards for completing budgeting or savings tasks to keep users engaged.
Personalized Dashboards → Age-specific insights to make financial data more relevant.
Educational Modules → Bite-sized content designed for younger users to improve literacy.
Smart Risk Alerts → Proactive notifications to warn against overdrafts or unusual spending.
👉 The goal was to turn insights into actionable, user-centered design improvements.
Challenges:
Designing solutions wasn’t straightforward — key challenges included:
Translating data into design: Making complex analytical insights actionable for UI/UX.
Balancing simplicity with depth: Keeping the interface clean while supporting multiple financial tools.
Encouraging adoption: Overcoming low baseline financial literacy, especially in younger demographics.
Stakeholder alignment: Ensuring product, design, and business priorities worked toward the same roadmap.
👉 These challenges required iterative design thinking and a strong focus on user behavior.
Conclusion:
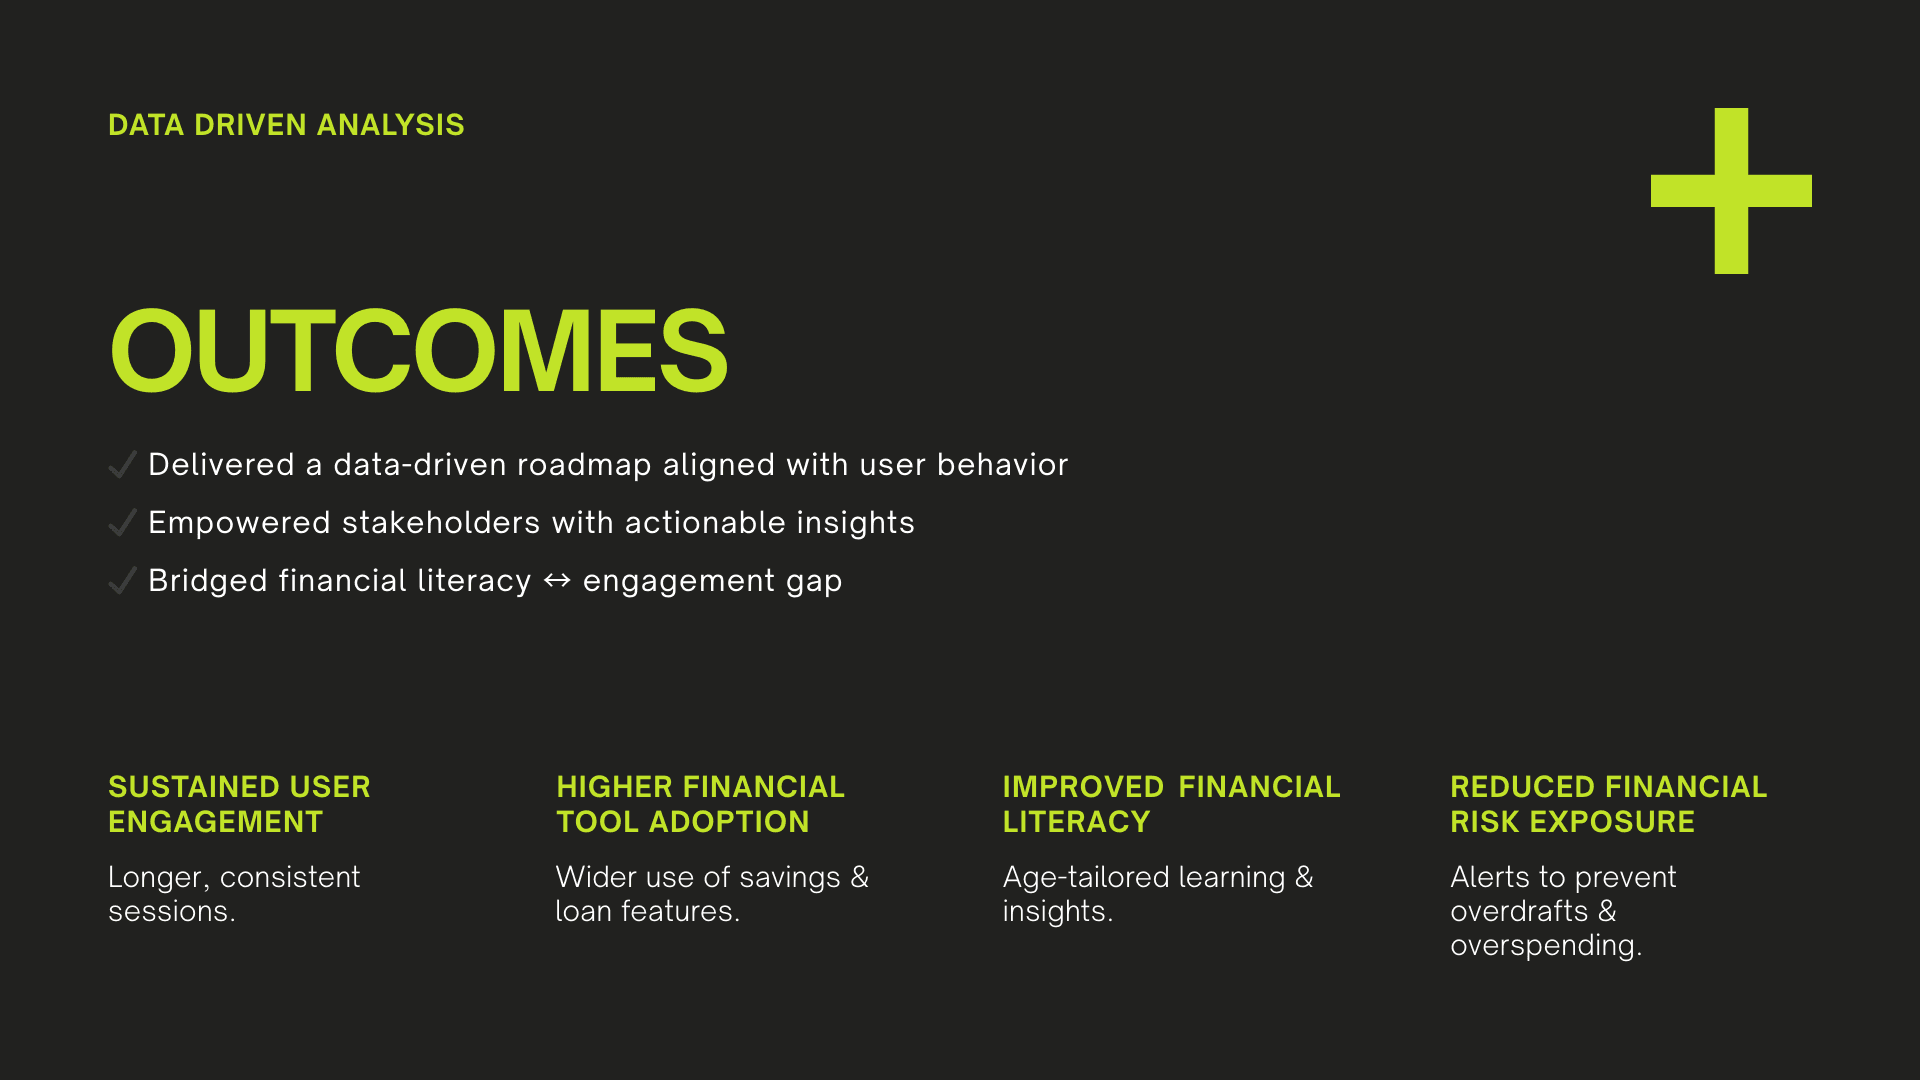
The project delivered a clear, data-backed roadmap that:
Defined requirements for sustained engagement, higher tool adoption, improved literacy, and reduced financial risk.
Empowered stakeholders with evidence-based design recommendations.
Bridged the gap between financial literacy and digital product engagement.
Positioned the platform as not just a utility, but an educational and protective financial partner.
👉 This case shows how behavioral data and design thinking can work together to make digital finance more accessible, engaging, and impactful.


Data Visualization (UX Design)
Data-Driven Optimization of a Digital Financial Tool
This research project focused on analyzing anonymized customer transaction and behavior data to identify key pain points and propose actionable enhancements for a financial service platform. The dataset included over 1,500 customer records spanning demographics, transaction history, and app interaction metrics.
Year :
2025
Industry :
Banking
Client :
Forage - Lloyd Banking Course
Project Duration :
2 weeks
Problem:
The digital financial tool was struggling to create meaningful engagement. Despite having useful features like a savings planner and loan calculator, adoption remained low. Younger users (18–35) in particular showed:
Short, inconsistent sessions (average 40% shorter than older groups).
Underutilization of planning tools (only ~18% adoption).
Behavioral signals of financial risk (frequent withdrawals and transfers, overdraft exposure).
👉 In short: users had tools available, but they weren’t discovering or connecting with them.
Solution:
A data-driven product optimization strategy was developed to align platform features with user needs:
UI/UX Redesign → Simplified navigation, made financial tools more discoverable.
Gamification → Rewards for completing budgeting or savings tasks to keep users engaged.
Personalized Dashboards → Age-specific insights to make financial data more relevant.
Educational Modules → Bite-sized content designed for younger users to improve literacy.
Smart Risk Alerts → Proactive notifications to warn against overdrafts or unusual spending.
👉 The goal was to turn insights into actionable, user-centered design improvements.
Challenges:
Designing solutions wasn’t straightforward — key challenges included:
Translating data into design: Making complex analytical insights actionable for UI/UX.
Balancing simplicity with depth: Keeping the interface clean while supporting multiple financial tools.
Encouraging adoption: Overcoming low baseline financial literacy, especially in younger demographics.
Stakeholder alignment: Ensuring product, design, and business priorities worked toward the same roadmap.
👉 These challenges required iterative design thinking and a strong focus on user behavior.
Conclusion:
The project delivered a clear, data-backed roadmap that:
Defined requirements for sustained engagement, higher tool adoption, improved literacy, and reduced financial risk.
Empowered stakeholders with evidence-based design recommendations.
Bridged the gap between financial literacy and digital product engagement.
Positioned the platform as not just a utility, but an educational and protective financial partner.
👉 This case shows how behavioral data and design thinking can work together to make digital finance more accessible, engaging, and impactful.